Introduction
Traceroute is a crucial tool in network diagnostics. Along with other Linux commands such as ping, ip, and netstat (or the newer alternative ss), Traceroute identifies the route packets take from source to destination. The tool is universally available for Linux, Windows, and macOS.
This article explains the traceroute or tracert command, how it works, and how to run and read a traceroute on Linux, Windows, and macOS.

Prerequisites
- Command-line/terminal access
- Network connection.
- A website or IP address to track (optional, provided in examples).
.
What is Traceroute?
Traceroute It is a command used in network troubleshooting to map the path that packets travel through the network. The tool helps in the discovery of possible information paths from the source to the destination. In addition, the command also helps to calculate transfer times between points.
When applied to network troubleshooting, traceroute helps locate where traffic between source and destination slows down.
How does Traceroute work?
The protocol sends Internet Control Message Protocol (ICMP) packets to each router that are transferred between the source and destination. When you run a traceroute, the output shows:
- The IP address of the router that successfully received the packet
- Travel latency, or the amount of time it took to get a response for each of the three probes
.
.
Traceroute acts as a series of ping commands. While ping requests a response from the destination, traceroute also collects the intermediate information.
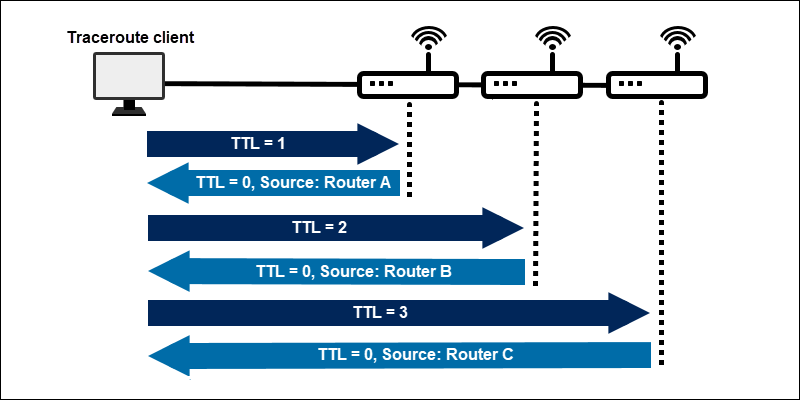
To collect the information available between the source and destination, a traceroute reduces the TTL (time-to-live) of the packet to a minimum (1). When a router receives the information, it decreases the TTL value to 0, indicating that it must send information to the source. The source collects the intermediate information from the router, resets the TTL value to 1, and increments it.
 This
Thisway, the packet reaches the next router on the network. The iterative process is repeated until the final packet reaches the destination IP. The destination IP is then recognized by traceroute and generates all the intermediate information collected.
The command sends three probes by default for each TTL value and prints the round-trip time for each packet.
How to run a traceroute?
Traceroute is available on most modern machines. The program is a command line tool with different options and syntax depending on the operating system.
By default, a traceroute is 30 hops for a packet size of 60 bytes for IPv4 and 80 bytes for IPv6.
Running a Traceroute on Linux
In Ubuntu, the traceroute command is not available by default. Install the tool using the apt package manager.
1. Open the terminal (CTLR + ALT + T) and
install traceroute with: sudo apt install traceroute
2. In the terminal, run
a traceroute with: traceroute [options] <hostname or IP> [packet length] For example, traceroute
one of phoenixNAP’s speed test IP locations
: traceroute 131.153.40.84
“traceroute command output on Linux” />
Alternatively, use a hostname:
traceroute phoenixnap.com
Advanced options for traceroute on Linux
By default, a traceroute sends UDP packets. Add
the -I option for ICMP probe packets: traceroute -I <host or IP name>
Include the –n option to hide device names for cleaner output:
traceroute -In <hostname or IP>
By default, the number of packets sent is three. Change the number with the –q option followed by the
number of packets: traceroute -Inq <number> <hostname or IP>
Reducing the number of packets to one increases the speed of a
traceroute. For all additional traceroute options, refer to the manual page in the terminal with the man: man
traceroute
The
manual contains information about all available command options and how to apply them to the command
.
Run a Traceroute in
Windows
Traceroute is available for Windows with the shorter name tracert. To run a traceroute on Windows, follow these steps:
1. Press the Windows key and type CMD.
2. Press Enter and open the command prompt.
3. Finally, run
traceroute with: tracert [options] <hostname or IP>
The output prints Trace complete to the console when the traceroute completes
. Run a traceroute on macOS To run
a traceroute on macOS
using the GUI, follow the steps below:
1. Click the Focus icon (magnifying glass).
2. Next, search for Network Utility in the search field.
3. Double-click Network Utility in the search result.
4. Locate and click the Traceroute tab.
5. Lastly, enter the IP address or host of the destination and click Trace. The text box below the Trace button displays the results of Traceroute.
How to read a Traceroute?
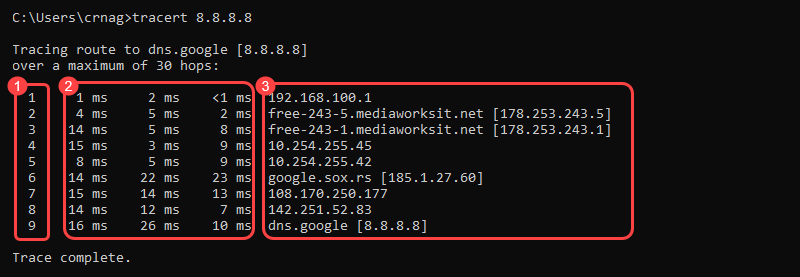
When a traceroute is executed, the output shows the route packets take when they travel to a destination point. The printed output is divided into three general
columns:

1. Each line indicates a router hop. The first column shows the jump number.
2. The following three columns show the round-trip time
(RTT) for a total of three packets: For nearby networks,
- these numbers are usually below 100
- For distant networks in other countries, typical RTT values go up to 300 ms.
ms.
Three asterisk symbols (* * *) instead of numbers followed by a “Timeout request timed out” message can indicate:
The router is down. The router is
- configured not to return traceroute results
- firewall is enabled on the router
- A timeout for one of the above routers
. A
.
.
3. The last column shows the destination IP address and, whenever possible, the resolved domain name.
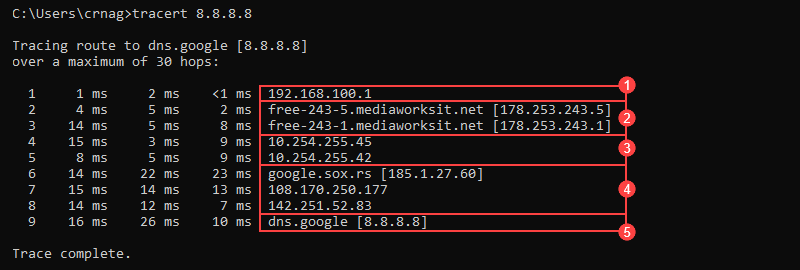
The traceroute output rows
are grouped into a total of five units:

1. The local network.
2. The Internet Service Provider (ISP) for the local network.
3. Internet.
4. The network of the destination host.
5. The destination address.
Add > <file name>.txt to the end of the traceroute or tracert command to save the results to a text file for later use and analysis. For example, on Linux and macOS:
traceroute 8.8.8.8 > results
.txt Windows users can follow the same steps:
tracert 8.8.8.8 > result.txt
In both cases, the output does not print anything and returns to normal command-line input. The file is saved to the location where the command is executed.
Conclusion By
the
end of this tutorial, you will know how to use and read the output of the traceroute or tracert command. Traceroute is a crucial tool for troubleshooting network issues and identifying connection bottlenecks.
If you want to learn more about traceroute compared to other terminal programs, read our article tracepath vs. traceroute.
For more network commands, see our guide to the nmap network scanner tool. It is a useful tool for searching for open ports.
